Do you have the same question, the same doubts as so many others?
We were asked: Why is there a plus of 35% on the biogas yield at SLP biogas plants?
What is the source of the biogas yield figures? What is the basis of the calculation?
The biogas yield figures are scientifically proved numbers of leading research institutes in Germany. They determine the figures for biogas yield calculations by laboratory testing.
Since decades, there is even a standard for this procedure in Germany. The details are described in the VDI directive 4630 so that test results are comparable. This directive is used by all research institutes.
For the following explanations, it is important to know that these tests are being executed under a temperature of 37°C and that these are single-stage-batch-tests.
The lab results are checked then by an expert panel which will there upon publish tables with standard values for the biogas yield calculations.
This publication of the KTBL – Kuratorium für Technik und Bauwesen in der Landwirtschaft (Association for Technology and Structures in Agriculture) is being reviewed every few years and is called “Gas yield in agricultural biogas plants”). The latest version was published in 2021
I have invested a lot of effort and time to analyse the figures of the KTBL for some sorts of input material.
Straw – my favourite input material because its digestion is difficult
Maize silage – it is the main input material in Germany
Organic waste – I used to digest it in my own biogas plants
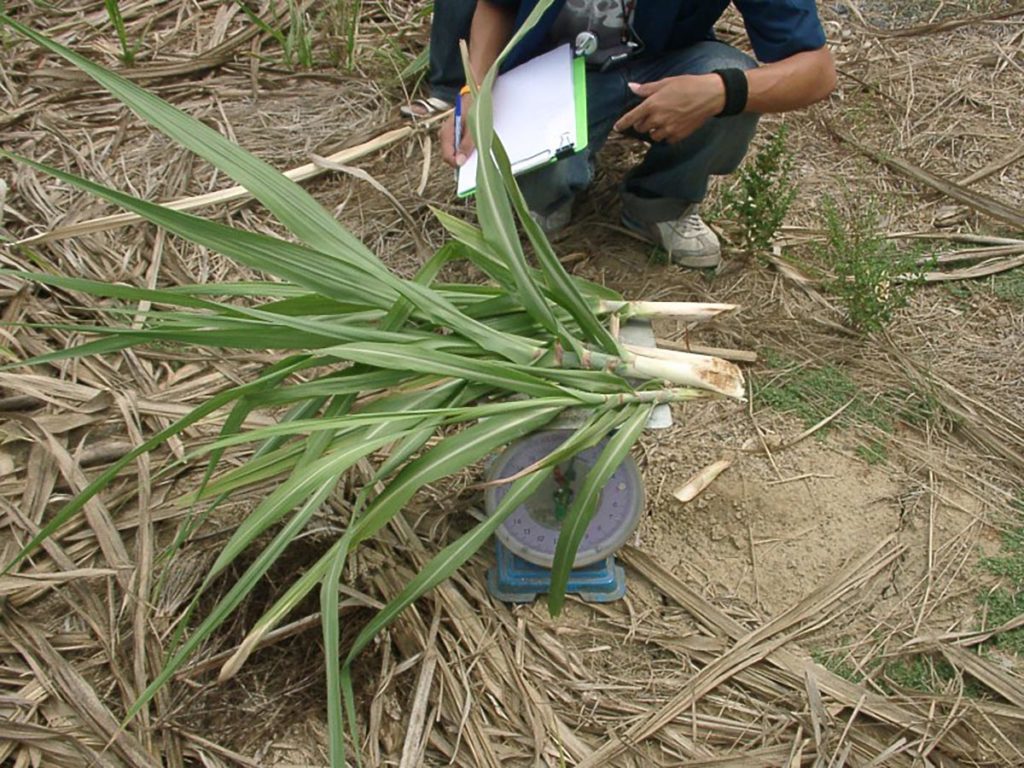
Napier Grass – I was asked by customers and partners from Thailand how I could assume a plus of 35 % on the gas yield
My Analysis!
„Where shall the additional biogas come from when everything has been digested?” a plant operator asked.
We at SLP add a plausibility assessment to the biogas calculation. We compare the weight of the VS (organic dry matter) with the weight of the produced biogas. Biogas is built out of the VS.
We calculate the produced biogas quantity per year und multiply it with the weight per m³ biogas. One cubic metre of biogas weighs between 1,1 and 1,3 kg/m³, depending on its CH4 proportion and CO2 proportion. The weight varies because CH4 is lighter than CO2. At a proportion of 52% CH4, biogas weighs 1,225 kg/m³. It weighs 1,130 kg/m³ at 60% CH4, like in the case of e.g. organic waste.
Sounds like a negligible difference. But when it comes to millions of cubic metres, this makes a difference of thousands of tons.
Then we look at the weight of the biogas and compare it with the weight of degraded quantity of VS.
Over and over again, we can see in our calculations that a lot of VS is not being degraded.
See below the overview of my analysis of the KTBL-figures regarding the unexploited biogas potential:
Example: Straw
KTBL 2021 specifies straw with 92% DM (Dry matter) which in turn are 94% VS. Thus, one ton of straw makes 865 kg of VS.
The further calculations are based on 1 ton VS.
The biogas yield is specified by KTBL with 452 m³ per ton.
The CH4 content is specified with 53% which means that one cubic metre of biogas weighs 1,214 kg/m³.
The biogas weight from 1ton VS is 549 kg.
The VS quantity is 1,000 kg. Subtracting the biogas weight of 549 kg, the result is a non-degraded VS of 451 kg.
The rate of degradation or the biogas quantity is 55%. (549 kg biogas / 1,000 kg VS)
Therefore, 45% of the VS is not being degraded but could still be transformed into biogas.
Taking into consideration 10% of lignin which is non-degradable, then there are 35% of the degradable VS that are not degraded yet. (45% rest VS – 10% Lignin).
There is an unexploited potential of 35%.
Referencing these absolute 35% to the KTBL figures (452 m³ biogas / t VS), there is still an increase potential for the biogas yield of a relative 64% (35% unexploited potential / 55 % biogas yield).
Example: Maize silage
Same calculation path.
The degradation rate is at 79%.
Referring to KTBL, there is an increase potential of 23 %.
In practice, a lot of biogas plants do exploit this potential due to lower lignin rates and due to higher temperatures in reality than in the lab.
Example: Napier Grass
There are no KTBL figures available but lab values from Thai laboratories.
At 25 % DM, 86% VS and a biogas yield of 481 m³ biogas / t VS with 52% CH4, the biogas weighs 589 kg/t VS.
With a lignin rate of 10%, almost 1/3 (33%) of the VS is not being degraded.
Mathematically, a plus of 311 kg biogas could be produced (1,000 kg VS – 589 kg biogas – 100 kg lignin).
As a result, there is an increase potential for the biogas yield of 53% (311 kg VS/589 kg biogas).
Evaluation and analysis of the figures
Degradation rates vary drastically with the different input materials because of their different composition. Maize has a high starch share and a low cellulose (fibre) share. The degradation rate of maize silage is relatively high at mesophile temperatures (37°C). Starch is easily degradable. Cellulose is difficult to degrade.
With straw and Napier grass, the cellulose (fibre) share is higher. Cellulose is difficult to degrade under mesophile conditions which keeps its degradation rate low.
Why then is SLP´s biogas yield 35 % higher?
That was the initial question.
Cellulose is the most common and cheapest biomass worldwide.
KTBL figures as well as our own calculations show that with single-stage-biogas plants and mesophile operation cellulose cannot be degraded. Therefore, a high increase potential remains for the biogas yield.
We are specialised in the degradation of cellulose. It was and still is our aim to degrade as much cellulose as possible. That´s what we have been focussing on in the past 15 years.
The reasons for our high degradation rates are:
- We run our biogas plants thermophile and hyper-thermophile
- We run high volumetric load in small, high load digestors in order to reach the ideal pH-values for the cellulose degradation. There is no chance for single-stage plants to reach that.
- We recirculate VS until they have degraded completely.
The influence of temperature on the degradation of cellulose
Cellulose is degraded by cellulases (encymes). The higher the temperature, the higher the activity level of the cellulases and thus the degradation speed.
Everyone knows the phenomenon of fever. We only get fever to increase the activity of our physical biology to fight a disease.
Cellulose is hardly degraded at a mesophile temperature range of 35-49 °C which is the reason for those low biogas yields with fibrous feedstocks in the laboratory (37°C referring to DIN guideline!).
Cellulases work better and faster at >50°C. We run our biological pre-treatment in small high load digestor in a hyper-thermophilic-way at 60°C and more. This makes a significant difference.
We operate the digestors between 55°C and 60°C.
Our SLP biological consultations for one-stage-stage plants keep proving that we can even increase the degradation rate only by rising the temperature.
Higher temperatures lead to a faster degradation of the biomass to biogas. Hyper-thermophile leads to higher degradation rates.
The influence of the pH-value on the degradation of cellulose
Cellulases need ideal environmental conditions to degrade the cellulose.
You can imagine cellulose like giant molecules. Hundreds of thousands of carbon atoms arranged in chains. Each of these carbon connections must be split up so that the bacteria can make biogas out of them. A gigantic effort for the cellulases.
The ideal pH-value for their maximum activity is around 7.
Within the digestor, there is usually a pH-value of around 8. At this value the activity of the cellulases is very low which is the reason for the poor performance of single-stage plants when it comes to degrading cellulose.
We feed our high load digestor for biological pre-treatment with a high volumetric load which is measured in kg VS/m³+day. We feed about 50 kg VS/m³+day. Thus, bacteria are producing a lot of fatty acids quickly which then reduce the pH-value from 8 to 7 leading to an attack of cellulases and then the fibres, the cellulose get degraded!
High temperature (1) + pH 7 (2) = High biogas yield + Recirculating (3) = Highest biogas yield
We create the ideal environmental conditions for the cellulases!
Starch, protein and fat will be easily degraded anyways. We can neglect this because it happens anyway without having to do much about it. We focus on the problem – the degradation of cellulose.
We won´t give up!
Sometimes, a cellulose molecule can´t be degraded within the first round.
For the biological pre-treatment within the high load digestor we need liquid to mix the input material. We take this liquid (recirculate) from the biogas plant. It still contains about 4% DM with a VS share. With a recirculate quantity of e.g. 200 m³ we return 8 t DM containing non-degraded VS back into the active process and there again cellulose will be degraded.
The biogas yield per ton VS increases once again!
SLP results put to practice
When visiting an SLP biogas plant, an experienced biogas operator can see the difference right away.
There are no heaps of solid digestate residues.
Single stage plants using a lot of fibrous feedstocks do not separate degraded biomass with a screw separator to keep it mixable. Then there are big heaps of solid, separated digestate below the separator which is a clear sign that the biology cannot degrade the cellulose.
At our SLP biogas plants there are no such heaps. Cellulose is degraded that much so that there is no solid matter left for the screw separator.
Environmental Assessment
German biogas plants receiving the manure boni are obliged to have an assessment from a state-approved appraiser every year.
The appraiser gathers data on feedstock quantities and electricity production and checks the data on plausibility.
Thousands of biogas plants are checked this way in Germany each year summing up to a massive data volume and reliable comparative figures.
Year after year, assessments confirm that the biogas yields at SLP biogas plants perform 35% above the average of all the audited plants.
Practice as well as appraisers confirm the results of the superior process biology of SLP.
Why then is SLP´s biogas yield 35 % higher?
That was the initial question.
SLP biology exploits the 35% biogas additional yield out of the cellulose. At SLP, the cellulose is degraded, at single stage plants this is not the case. That´s the difference.
Can you also reach that with single stage plants?
No!
No, because you don´t reach the ideal pH-value of 7.
No, because also the recirculation in single stage plants doesn´t help due to the wrong pH-value.
Do you have any questions?
Any uncertainties?
Do you have still any doubts?
Send me an e-mail: w.danner@snow-leopard-projects.com


